This project was born from the historic mobilizations of 2020. Those sustained and massive demonstrations against anti-Black police violence called for a fundamental transformation in how policing takes place in neighborhoods and, perhaps more profoundly, in how to understand, value and invest in public safety (Kaba & Ritchie, 2022). From those protests, a three-year partnership emerged between the Public Science Project (PSP) and a city-wide coalition, Communities United for Police Reform (CPR), to produce a study that became known as the Community Safety Project. It was designed to center the knowledge, experiences, and desires of those who have most felt the impact of the NYPD’s law-and-order public safety practices – largely communities of color, especially Black and Latinx communities – and therefore, most necessary for crafting policy solutions that offer both safety and justice. Toward those efforts, we employed participatory action research (PAR; Torre et al., 2012), which provides a methodological and ethical framework for making research a public good.
This participatory, large-scale study across all five boroughs used 10 in-depth virtual town halls (N=550) and an extensive citywide survey (N=2,753) to understand the perspectives and experiences on safety and policing of 3,303 New Yorkers who live in the most heavily policed neighborhoods across all five NYC boroughs.
In the ethos of PAR, representatives from CPR membership organizations conducted all aspects of the Community Safety Project — developing the methods, collecting information, analyzing data and communicating results — through a deeply collaborative process that drew upon the group’s substantial expertise as organizers, educators and, advocates. CPR staff and PSP members facilitated the study but it was primarily led by a research team of eight community-based organizations that received additional support from an advisory group consisting of nine organizations. All CPR organizations leading or involved with this study have worked extensively in, with, and on behalf of New Yorkers and New York communities most impacted by policing.
The study began in September 2020 and involved two primary methods: community safety town halls and community safety surveys.
Community Safety Town Halls
In February 2021, the research collective worked with other CPR organizations to host 10 virtual town halls, representing all five boroughs, on a range of topics related to safety and intended for people living in communities directly impacted by heavy policing (see HERE for more details). Each event was several hours and offered facilitated, open space to reflect on experiences with safety and policing, city budget priorities, and potential solutions in areas needing change. Town halls used a standardized format that included large- and small-group discussions and a brief online survey. The standardized agenda, tailored for each event, included:
- An opening to welcome guests including a description of the forum’s purpose and why it’s important,
- Small-group breakout discussion groups to reflect on their community experiences with safety and policing with a large group debriefing to follow,
- A two-question online survey. The first open-ended question asked “What makes you feel safe in your community? In your own words, what does community safety mean to you?” The second question asked attendees to go through 20 different areas and “Indicate how you feel each area should be prioritized in the city budget during the coming fiscal year,”
- The facilitation of small- and large-group conversations imagining and prioritizing the areas they see as critical for safety and identifying actionable solutions and concrete reforms,
- Closing and next steps.
Each event had American Sign Language interpretation as well as closed captioning. They were also recorded, and extensive notes were taken to systematically analyze the themes discussed. In total, over 550 New Yorkers attended these open forums to voice their needs, desires and recommendations for safe, healthy, equitable and thriving communities. The town halls were co-sponsored by 22 diverse organizations representing communities and interests across the city, including NYC Anti-Violence Project, Audre Lorde Project, Bronx Defenders, Brooklyn Movement Center, Center for Anti-Violence Education, Center for Constitutional Rights, Color of Change, Desis Rising Up and Moving (DRUM), FIERCE, Gathering for Justice, Girls for Gender Equity, Justice Committee, Justice League NYC, Legal Aid Society, LIFECamp, NAACP Legal Defense and Educational Fund, Make the Road New York, New York Civil Liberties Union, VOCAL-New York, Public Science Project, Rise of Staten Island and True 2 Life.
Demographics for town hall participants are as follows:
Age: 22% 10-20, 34% 21-30, 21% 31-40, 10% 41-50, 6% 51-60, 5% 61-70, 3% 71+
Race/Ethnicity: 25% Black, African American, Afro-Caribbean, 17% Latina/o, Latinx or Hispanic, 8% Asian, 30% White, 1% Arab or Persian, 13% Multiracial, 3% Other, 3% Prefer Not To Answer
Gender: 23% Boys/Men; 60% Girls/Women, 15% Non-Binary, Gender-Fluid, Questioning/Unsure, Multigender, 2% Prefer Not To Answer
Sexual Identity: 48% Straight, 43% Asexual, Bisexual ,Gay, Lesbian, Pansexual, Queer, Multisexual and/or Questioning/Unsure, 9% Other or Prefer Not To Answer
Borough: 13% Bronx, 31% Brooklyn, 25% Manhattan, 17% Queens, 7% Staten Island, 7% Outside of NYC.

Community Safety Survey
Over the course of eight workshops, between September 2020 and April 2021, which ranged from several hours to half days, the research collective then used the town hall discussions along, with eight additional workshops that ranged from several hours to half days, to develop a large, 10-section survey asking questions about community safety and experiences with the NYPD. Due to the pandemic, the survey development process was conducted entirely online using Zoom. Despite the challenges, available tools like Jamboard and virtual breakout rooms made the collaborative process for developing community-based surveys largely the same as other similar projects. In this case, several members of the research collective had recently completed a project on policing that included a community-based survey. We decided to use that survey as a starting point for building our own. This gave us the benefit of not only having an opportunity to reflect on previously developed questions but also, its results. This allowed the group to reflect on how they interpreted the findings, see how single items were aggregated and how that might impact the story, unpack the assumptions of the survey, consider what items are valuable and what is missing, gain perspective on how the phrasing of questions on the same concept can prompt different responses, and run new analyses off the old dataset. In short, it offered the group, generally new to research, a meaningful entrance into this work. For example, to understand “negative and positive experiences during police encounters,” we used Jamboard, an online google platform that allows everyone with the link to simultaneously use different color “sticky notes.”
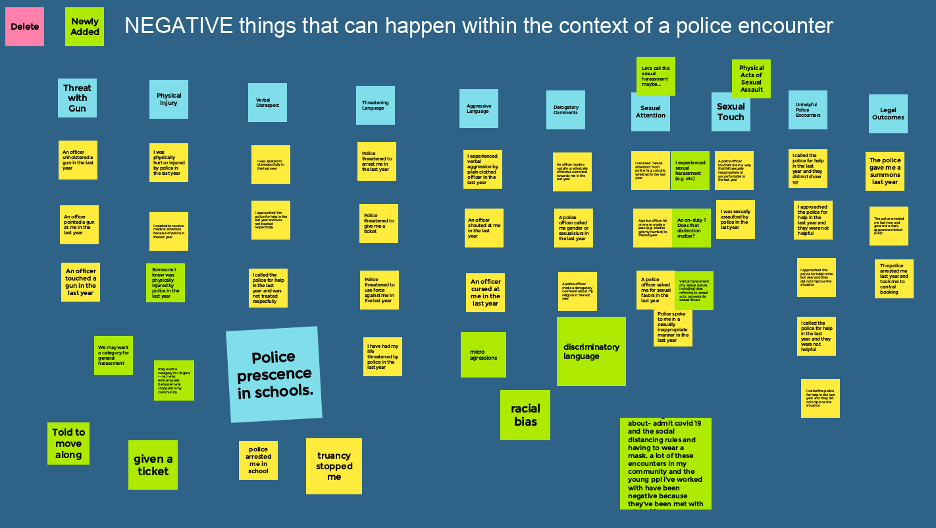
In these sessions, we moved notes around to cluster thematically similar or connected ideas. We revised, deleted, and amended notes in real-time, coming to agreements on content and phrasing. In partnership, we were drawing from each other’s wisdom, using knowledge gained from direct experience to conceptualize the general and specific architecture of the survey. We used exercises like this and others to work our way, section by section, item by item, until we had enough material for a very rough first draft. The themes of the 10 survey sections were:
- Feeling and Producing Community Safety,
- Policing and Community Safety,
- Attitudes towards Police,
- Observing and Feeling Police Surveillance,
- Calling the Police,
- Having the Police Called on Them,
- Police Contact and Violence,
- Police Sexual Violence,
- The Impact of Police on Self and Family,
- Demographics.
The survey draft went through many rounds of revisions as the research collective and other CPR members provided ongoing input. The survey was then piloted with eligible community members, which resulted in further revisions. In total, the survey went through more than 25 drafts, with edits from numerous experts, and was responsive to grassroots, legal, policy and academic feedback. After more than one year since its construction began, the final survey was completed in November 2021, serving as a testament to the deeply collaborative process and commitment to being accountable to the communities most affected by policing. After the survey was finalized, it was entered into an online survey software and translated into Spanish and simplified Chinese. All surveys were taken on tablets, smartphones or computers. All New Yorkers 16 years and older living, working, going to school or spending considerable time in the designated areas were eligible to take the survey. The surveys were distributed between November 2021 and February 2022 over two phases.
The first phase involved community sampling in seven locations across all five boroughs: Lower East Side, Manhattan; Fordham Heights, Bronx, Corona & Jackson Heights, Queens; Bedford-Stuyvesant & Crown Heights, Brooklyn; Brownsville & East New York, Brooklyn; Red Hook, Brooklyn; Stapleton & Clifton, Staten Island.
The locations represented neighborhoods with high police presence and activity, as determined by an index the research collective constructed from publicly available policing data. The research collective created an index of the most “heavily policed” neighborhoods (defined by ZIP code) in 2021 using the following publicly available indicators: misdemeanors arrests (January to June 2021); misdemeanor complaints (January to June 2021); felony arrests (January to June 2021); violation complaints (January to June 2021); criminal court summons (January to June 2021); B summons (January to June 2021); shootings (January to June 2021); calls for service (January to June 2021); stop, question and frisks (January 2019 to December 2020). The geocoded locations of the police activity were mapped using QGIS and then overlaid with ZIP codes. Raw values within ZIP code were divided by square meters to standardize spatially. Z-scores were then created for the values of each indicator of police activity to standardize around the average. The Z-scores were added together, averaged and then ranked by ZIP code throughout New York. The rankings were divided into thirds to create high-, medium- and low-policed categories. Similarly, Z-score rankings leading to three categorizations (e.g., high, medium, low) were also created from the raw values (e.g., not standardized by square meters) of police activity. This research defined “high policed” as any ZIP code that is in the top one-third of police activity citywide from either the raw or spatial Z-scores. In addition to this index, public housing, socioeconomic factors, racial demographics and CPR organizational locations were closely considered as well.
Surveys were distributed within communities using Respondent Driven Sampling (RDS; Heckathorn, 1997), an approach effective at collecting data from what are often considered hard-to-reach populations; minimizing selection bias; and improving sample representativeness. Respondents were compensated for taking the survey and then offered additional compensation for referring up to three eligible people from their networks. In an exponentially snowballing fashion, RDS draws people to the study in an ever-widening community network. In each neighborhood, eligible people were first recruited to take the survey for $25. When finished, survey participants were given three unique ID tickets to distribute to people they knew who qualified for the study and then paid $10 for each one who ultimately showed up to complete the survey. The newly recruited respondents were also paid $25 to take the survey and also given three tickets that could generate an additional $30. Surveys were available between two to five days at each community-based site and during hours that accommodated unemployed and employed respondents. Every location included indoor seats and tables with enough space to apply social distancing protocol and other COVID-19 health measures such as wearing masks. The survey took respondents approximately 20-60 minutes to take on a tablet or, in some cases, their phone. CPR members and organization volunteers were always present to assist people, helping to ensure that items were interpreted and answered accurately as well as making sure people were promptly paid for their time.

As a supplement to surveys collected at community sites, we then pursued an online panel sample by contracting with Qualtrics, a digital survey platform that partners with over 20 online recruitment providers to cultivate representative pools of people by ZIP code (see qualtrics.com for more details). Using the policing index as an indicator of ZIP codes with heavy police presence, the online panel sample was designed to reach a wider representative sample of New Yorkers who live in highly policed neighborhoods. The online panel sample was designed at first to reach additional people living in high policed neighborhoods. However, it also offered an opportunity to collect a smaller representative sample of New Yorkers who live in medium- and low-policed ZIP codes with the goal to serve as a potentially illuminating comparison group. In total, this enabled us to collect surveys from over 4,000 New Yorkers. The data from the medium- and low-policed ZIP codes are not included in this report. The original survey was too long for this type of sampling strategy and therefore was cut into two shorter surveys that were randomized for each respondent upon entering the platform. This reduced the completion time to between 15-30 minutes. Upon completion of the first half, respondents were offered the chance to take the second half of the survey at another time for additional compensation.
Demographics for all survey respondents are as follows:
Age: 9% 16-20, 22% 21-30, 20% 31-40, 16% 41-50, 18% 51-60, 11% 61-70, 4% 71-80, 0.4% 81+
Race/Ethnicity: 35% Black or African American, 28% Latinx, 7% Asian, 4% Other People of Color, 13% White, 1% Multiracial – Other, 6% Multiracial – Black/Latinx, 5% Prefer Not To Answer
Gender: 42% Boys/Men; 54% Girls/Women, 2% Transgender, Non-binary, Two-spirit, and/or Questioning, 2% Other, Did Not Answer or Prefer Not To Answer
Sexual Identity: 64% Straight, 23% Asexual, Bisexual ,Gay, Lesbian, Pansexual, Queer, and/or Questioning, 14% Other, Did Not Answer or Prefer Not To Answer
Immigration Status: 75% Born In The U.S., 19% Born Outside The U.S., 1% Other, 5% Prefer Not To Answer
Disability Status: 77% Nondisabled; 12% Disabled, 11% Prefer Not To Answer
Public School: 59% Attended NYC Public School, 36% Did Not Attend NYC Public School
Highest Level of Education: 16% Less Than High School, 30% GED or High School Diploma, 17% Some College, 27% Associates, Bachelors, or Graduate Degree, 11% Other Or Prefer Not To Answer
Employment Status: 43% Employed Full Time (35+ hours), 11% Employed Part Time, 20% Unemployed and Looking For Work, 8% Unemployed and Not Looking For Work, 5% Self-Employed, 1% Off The Books or Under The Table, 10% Out Of The Workforce, 7% Other, 11% Prefer Not To Answer;
Borough:18% Bronx, 35% Brooklyn, 30% Manhattan, 12% Queens, 6% Staten Island
Housing Status: 80% Stably Housed, 13% Precariously Housed, 7% Other, Did Not Answer, Prefer Not To Answer
Homelessness History: 65% Never Homeless, 7% Homeless Since 2020, 16% Homeless Before 2020, 2% Homeless Before and Since 2020, 10% Prefer Not To Say
Yearly Family Income: 62% Less Than $29,000 or No Source Of Income, 19% $30,000-$69,000, 8% $70,000 – $109,000, 7% $110,000+, 5% Other, Did Not Answer, Prefer Not To Answer.

The research collective organized all survey data and analyzed it using SPSS, a statistical analysis program. We then cleaned and analyzed the surveys, using multiple workshops with CPR and PSP members to collaboratively make sense of the findings and discuss their implications. We systematically cleaned the data by reading closely through every survey to locate suspicious response behavior such as straightlining, zigzagging, exaggeration, irrelevance, incompletion, outliers or duplication. We determined that 201 surveys (7%) out of the 2,954 were untrustworthy or of poor quality, and we removed them, resulting in 2,753 usable surveys. Every survey question was examined using exploratory data analysis strategies.
We also thematically analyzed the qualitative data from both the town hall transcripts as well as the responses collected from opened ended questions using a participatory adaptation of Braun and Clarke’s (2012) process. Some of the open-ended items in the survey were content analyzed so the thematic counts could speak with other variables in the dataset. We used multiple workshops and ongoing meetings with various combinations of CPR and PSP members to collaboratively make sense of the findings and discuss their implications. Every survey question was examined using exploratory data analysis strategies adapted for a participatory process (Stoudt, et al., 2019). We frequently combined multiple survey items (e.g., “Handcuffed you and then let you go” and “Handcuffed and then detailed you”) to create higher-order variables (e.g., “Handcuffed by Police”). This aggregation is a type of statistical thematic coding that encouraged deeper theorizing and therefore, had important conceptual relevance to our work.


This entry is licensed under a Creative Commons Attribution-NonCommercial-ShareAlike 4.0 International license.